In this transmission, I give you my thoughts and impressions on one of the ways the deep state tried to close the deal in the 90's along with context and emotion.
Also ...
From Census.gov:
Two States, A Third of Counties Have More Deaths Than Births
https://www.census.gov/library/stories/2017/10/aging-boomers-deaths.html
JASON DEVINE
OCTOBER 24, 2017
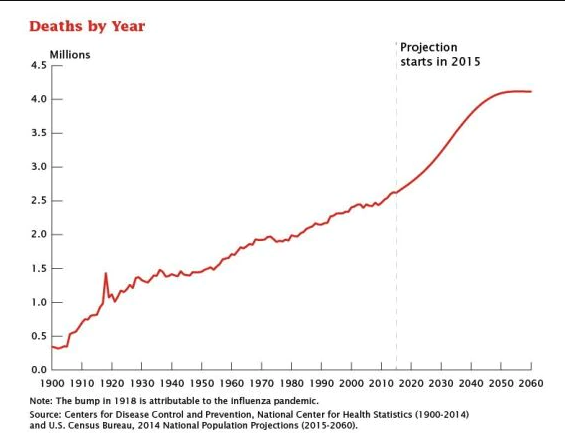
The aging population of the United States is propelling the nation toward a milestone: A historic increase in the number of deaths every year.
Deaths are projected to reach more than 3.6 million in 2037, 1 million more than in 2015. As the nation’s baby boom cohort ages (the youngest are 53 this year), the number and percentage of people who die will increase dramatically every year, peaking in 2055 before leveling off gradually.
The nation as a whole is aging, but not every area of the country or every racial and ethnic group is graying at the same rate. Yet, in some areas, mortality is having a surprisingly substantial impact on the remaining population. As part of our mid-decade research plan, we take a look at trends in our 2015 series of population estimates.
While the U.S. population as a whole is not expected to experience natural decrease (fewer births than deaths), two states (West Virginia and Maine) and almost a third of counties experienced this demographic threshold in 2015. In these areas, unless a sufficient number of people move in, the population will decline every year. As the older population dies, the racial and ethnic makeup of the younger population will play a larger role in shaping the demographic profile of the population. In most areas, the impact is minor year to year, but over time these patterns will bring about substantial changes. With the highest median age of all racial and ethnic groups (43.3), the non-Hispanic White alone population is the only group projected to experience natural decrease in the near future. The Hispanic population has a lower median age (28.8) than the non-Hispanic population (40.3) while the non-Hispanic two or more race population has the lowest median age, at 19.9 years.
GRAY AND GRAYER
Florida had the highest percentage of its population age 65 and over in 2015 (19.4 percent), followed by Maine (18.8 percent) and West Virginia (18.2 percent). One county, Sumter County, Florida, has a majority of its population (54.8 percent) age 65 and over. The map below shows the median age by county in 2015.
The ratio of deaths to the total population shows those states where deaths are having the greatest impact on the population. Based on the data used in the population estimates, nationally, there were 8.2 deaths per thousand people in 2015. For states, this ranged from a high of 11.8 deaths per thousand in West Virginia to a low of 5.2 in Utah. In addition to West Virginia, the other states with the highest ratios of deaths to the total population include Alabama, Pennsylvania, Maine and Mississippi. West Virginia and Maine have experienced natural decrease for the period between the 2010 Census (April 1, 2010) and July 1, 2015. Meanwhile, Alabama, Mississippi and Pennsylvania had more births than deaths in this period. The map below allows us to see how natural increase is playing out from state to state.
While only two states experienced natural decrease from 2014 to 2015, almost a third of all counties did. For counties, rather than look at the ratio of deaths to the total population (crude death rates), we will use the rate of natural decrease relative to the total population. This better identifies those counties without younger populations that could offset the losses from mortality with higher numbers of births. Ontonagon County, in Michigan’s Upper Peninsula, has the highest rate of natural decrease at 13.2 per thousand. The top 10 counties by rate of natural decrease (shown in the table below) include mostly smaller counties (populations of less than 20,000). Citrus and Sumter counties in Florida are the exceptions with 2015 populations of over 100,000. All top 10 counties can be found in Michigan, Virginia, Nevada, Florida, New Mexico and California.
The locations of the counties with the greatest natural decrease shifts when only larger counties (those with populations greater than 100,000) are considered. Of counties above this population threshold (shown in the table below), Citrus County, Florida, has the highest rate of natural decrease at 10.5 per thousand. Seven of the top 10 larger counties with the highest rate of natural decrease are in Florida. The others are Barnstable County, Massachusetts, and Mohave and Yavapai counties in Arizona. In all but three of the counties at the top of the list, non-Hispanic Whites make up a much larger share of the population than in the nation as a whole.
Despite high rates of natural decrease, these larger counties either gained population since the 2010 Census or only had small population losses. However, all of the top 10 smaller counties with the highest rates of natural decrease lost population over the same period of time.
AGING IN PLACE AND RETIREES
Populations can age in two ways. In the first way, there may be something about the area, such as affordable housing or warm weather that attracts older people, in many cases retirees (as we see in Citrus County, Florida). In the second way, an area may have a younger population that ages in place while no longer attracting a steady flow of younger people (as we see in Ontonagon County, Michigan). Either scenario results in an aging population, but in the first scenario, as long as the flow of people moving in replaces the number of those who are dying, the size of the population will stay roughly the same.
Data on migration show that in both Ontonagon and Citrus counties those moving in have a higher median age than those moving out. While both counties have high natural decrease, where they differ is in their levels of migration. In Citrus County, in-migration has offset losses due to deaths, and its population declined only slightly (down 0.1 percent since April 1, 2010), whereas Ontonagon County had negative net migration (more people moved out than in) and has seen a substantial population decline of 11.5 percent during that same period. The two areas are representative of different situations found in aging counties: one where the population is staying the same or growing because of in-migration, and another where the county is not attracting enough new residents to replace those they lost through deaths.
Unless something changes and those increasingly graying counties can attract more migrants, their populations will likely continue to decline.